The Job Flow Diagram tool allows you to create job flow diagrams, which are graphical representations of your jobs that can be used to review and document your job setup.
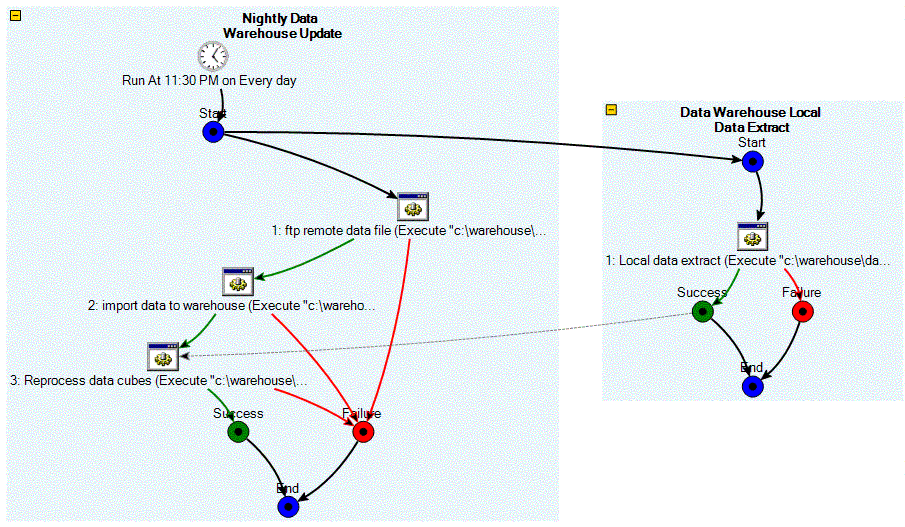
Diagrams are created automatically based on your job setup. For example, this diagram shows the "Nightly Data Warehouse Update" job and the "Data Warehouse Local Data Extract" job from the job setup example.

To create a diagram, simply select the job you are interested in and click Create Diagram. The diagram will automatically include any jobs that are linked to the job, so you only need to select one job in the chain. You can select multiple, unrelated jobs if you like.
|
|
Instead of using the Job Flow Diagrams view, you can select a job in the Console's main job list and choose "Diagram job/chain" from the job's context menu. |
|
|
The diagramming tool does not currently allow you to build or edit your job graphically (i.e., "drag and drop"), though this functionality is planned for a future release. You can display the normal dialogs for jobs, steps, actions, and links by double-clicking them in the diagram. |
Each job is represented by a shaded box. Initially the diagram will show the complete internal details of all of the selected jobs (and the jobs linked to them). Each trigger, condition, step, and action for the job is displayed. Links between jobs are also shown.
To hide or show the details for an individual job, use the collapse
( ) and expand (
 ) buttons found on each job.
You can also expand (
 ) and collapse (
 )
all jobs at once.
By default, jobs, triggers, steps, and actions are labeled, but links
are not. To see a description of a link, click it, and information will
be displayed in the Properties box to the right of the diagram. You can
turn on display of labels if you prefer, using labels toggle button ( ).
).
Links are color-coded to allow you to get a sense of the job flow without needing labels on the links:
|
Solid black link |
Represents a course that is always taken |
|
Green link |
Represents a course that is taken on success |
|
Red link |
Represents a course that is taken on failure |
|
Yellow link |
Represents a course that is taken in "warning" conditions |
|
Grey dashed link |
Represents a condition that must be met (does not indicate a direct action). In the sample diagram above, the end node of "Data Warehouse Local Data Extract" has a condition link to step 3 of "Nightly Data Warehouse Update". This indicates that step 3 of "Nightly Data Warehouse Update" cannot run until "Data Warehouse Local Data Extract" completes, but does not mean that "Data Warehouse Local Data Extract" directly runs step 3 of "Nightly Data Warehouse Update". |
You can edit an object (job, step, link, action, condition, or trigger) by double-clicking it on the diagram. If you make any changes, the diagram will be redrawn automatically.
The diagram can be printed using the Print ( ) and Print
Preview (
 ) buttons on the Toolbar.
Diagrams can be saved to a file using most common graphics image formats.