Job Schedule and Dependency Visualizer
Version Compatibility: ![]() Server version 4.0 or later
Server version 4.0 or later ![]() Console version 5.1 or later.
Console version 5.1 or later.
The Job Schedule and Dependency Visualizer creates a Gantt chart–style diagram showing the start times, average run times, and dependencies for selected jobs.
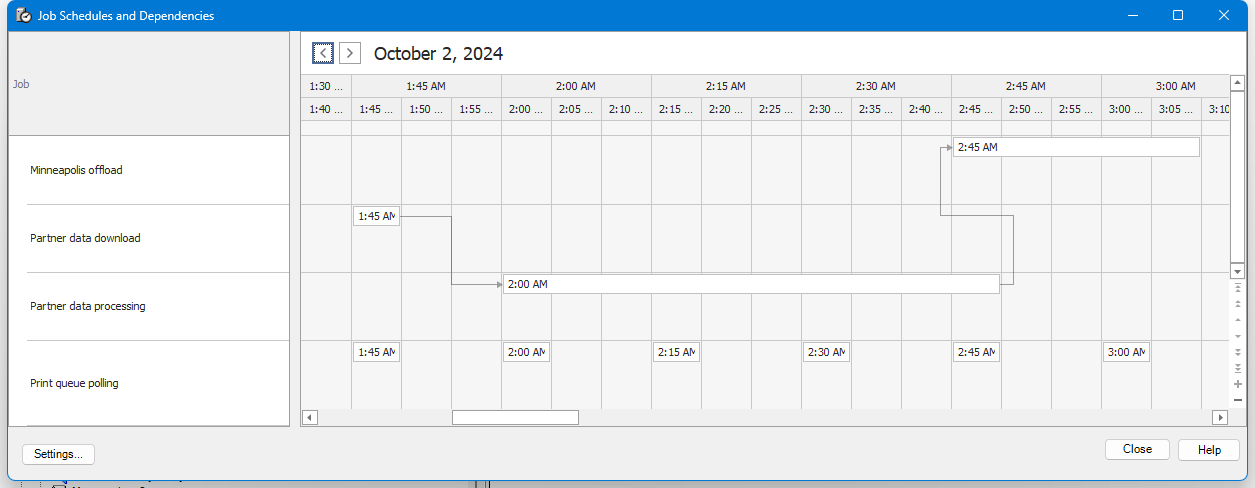
Each scheduled instance of a job is represented by a bar on the chart at its scheduled or expected start time, with the length (duration) of the bar based on the average execution time for the job. Dependency lines show jobs that are linked by Job Conditions, Job Control Actions, or Job Triggers.
Jobs are shown only if they use Schedule Triggers or are linked (through a Response or Job Trigger) to a job that uses a Schedule Trigger. For example, if a job only uses File Triggers, adTempus does not include it on the diagram.
Configure Chart
When you launch the tool or click the Settings button the Configure Chart window is presented.
Jobs
Select the jobs or groups to include in the chart. Selecting a group includes all jobs in the group.
Filter by Tag
Select or deselect jobs based on Tags.
Projection Period
Select the starting and ending dates/times that you want to display the diagram for.
Calculation Period
Select the source for the average execution time used to show job duration.
- Use all-time statistics. This option uses the statistics accumulated over all runs of the job since it was created (or since the last time the statistics were reset). This information is shown on the Statistics page of the Job List view.
- Calculate statistics from this time period.
 Use this option to calculate the average execution time for the jobs based on the history from the specified time range. Note that there must be instances in the Job History for this time range (if you only retain 30 days of history for jobs and you choose a time range from 90 days ago, there is nothing for the tool to look at).
Related Topics